
Sales Call Transcript Analysis: 14 Metrics That Actually Matter

Recording every sales call is easy now. Getting anything useful out of the recordings is not. Most teams end up with thousands of transcripts, a dashboard full of numbers, and no clearer idea of why some reps close and others do not.
The problem is usually that the wrong things are being counted. Below are the 14 metrics worth pulling from a sales call transcript, what each one actually tells you, and the popular ones that quietly mislead.
If you only track three metrics, track these. They cover most of what separates a rep who closes from one who does not:
The fastest way to spot a rep who is presenting instead of discovering. Aim for the prospect speaking slightly more on discovery calls.
A direct measure of whether the rep is actually running discovery. Low counts almost always correlate with weak qualification.
Did the call end with a specific date and named people? This is the strongest single predictor of whether a deal progresses.
The rule underneath all of them: a metric is only worth tracking if a rep can change their behaviour on the next call because of it. Anything else is reporting, not coaching.
What is sales call transcript analysis?
Sales call transcript analysis means turning recorded conversations into text and then measuring what happened inside them. Rather than a manager listening to two calls per rep per month, software transcribes every call and pulls out signals you can count: how long the rep spoke, how many questions they asked, which competitors came up, whether a next step was agreed.
The value is not the transcript. It is the shift from anecdote to pattern. One call tells you how one conversation went; two hundred transcripts tell you that your reps are talking for 68% of discovery calls and that deals where pricing comes up in the first ten minutes close at half the rate.
Conversation quality metrics
Talk-to-listen ratio
The share of the call the rep spoke versus the prospect. It is the most cited metric in conversation intelligence because it is simple and because the failure mode it catches — a rep pitching instead of listening — is so common. Discovery calls should sit near or below the halfway mark; demos naturally run higher because someone has to walk through the product.
Spot reps who are presenting when they should be diagnosing. Compare a rep’s ratio on won deals against their lost ones before assuming a target.
Longest monologue
The single longest uninterrupted stretch of rep speech. This often reveals more than the overall ratio, because a rep can hold a healthy average while delivering one seven-minute unbroken pitch that lost the room. It is the metric most likely to explain a call that felt fine on paper and went nowhere.
Find the exact moment a call stopped being a conversation. Play that segment back in a one-to-one — it is usually self-evident.
Longest customer story
The longest uninterrupted stretch the prospect spoke. When a buyer talks for two or three minutes without being cut off, they are usually explaining a problem in their own words — which is the most valuable thing that can happen on a discovery call. Reps who generate long customer stories tend to qualify far better.
Identify reps who create space for the buyer to talk, and use their calls as coaching examples for reps who fill every silence.
Interruption rate
How often the rep speaks over the prospect. Some overlap is natural in an engaged conversation, so this is only meaningful in comparison — a rep interrupting three times as often as the team average is not being enthusiastic, they are cutting off the information they need.
Coach reps who cannot hold a pause. Pair it with longest customer story for the full picture.
Question-to-statement ratio
The proportion of rep speech that was a question rather than an assertion. It separates a genuine discovery conversation from a presentation with question marks attached. A rep making twenty statements and asking two questions is not qualifying, regardless of how good the statements are.
Check that discovery calls actually contain discovery. Track it against call stage — high on discovery, lower on demo, is the pattern you want.
Content and discovery metrics
These measure what was actually said rather than how the airtime was divided. They are harder to extract and considerably more useful, because they tell you whether the rep learned anything — and, aggregated across a team, they tell you things about your market that no individual call reveals.
Questions asked per call
A raw count of questions the rep asked. Blunt, but effective: research into recorded sales calls repeatedly finds that asking more questions correlates with higher close rates, up to a point. Very low counts are nearly always a qualification problem rather than a style choice.
Set a floor rather than a target. A rep consistently asking three questions on a discovery call needs a call structure, not encouragement.
Open vs closed question mix
Whether the rep's questions invite explanation or a yes-or-no answer. Ten closed questions produce a checklist; four open ones produce a story you can sell into. This is harder to extract automatically than a raw count, but far more diagnostic.
Improve question quality once volume is already adequate. Rewrite a rep's three most-used closed questions as open ones.
Discovery topic coverage
Whether the call covered the things you have decided every qualified opportunity must cover — budget, timeline, decision process, current solution, the cost of doing nothing. Measured as how many of your defined topics were touched, it turns a vague sense of "good discovery" into something countable.
Find which qualification topic your team skips most often. It is usually decision process or the cost of inaction.
Objection frequency and type
Which objections come up and how often. Aggregated across hundreds of calls this stops being coaching data and becomes market intelligence — a pricing objection appearing in 60% of calls is a positioning problem, not a rep problem.
Feed the top three objections into enablement material, and tell marketing which one keeps appearing.
Competitor mention rate
How often competitors come up, which ones, and in what context. Rising mentions of a specific rival is one of the earliest signals available that a market is shifting, and it usually shows up in transcripts months before it shows up in win rates.
Spot new competitive threats early and check whether reps are handling each one consistently.
Pricing discussion timing
How far into the call price was first raised. Pricing that comes up in the first few minutes normally means value has not been established yet, and those conversations tend to become negotiations rather than sales. Which side raised it matters as much as when.
Coach reps to defer price until the problem is clear. Compare timing across won and lost deals in your own data.
Outcome and pipeline metrics
These connect what happened in the conversation to what happens next in the deal. They are the metrics worth reporting upward, because they are the ones that move revenue rather than describing behaviour.
Next-step commitment rate
The share of calls that ended with a specific, dated, mutually agreed next action — not "I will send some information" but "Thursday at two, with your finance lead". Across most pipelines this is the strongest single predictor of progression, and it is entirely within the rep’s control.
Make it a non-negotiable habit. It is the fastest metric to improve and the one with the most direct revenue effect.
Sentiment trajectory
How sentiment moved across the call rather than its average. A call that starts sceptical and ends warm is a good call; one that starts warm and ends flat is a warning, even if the average looks fine. The shape carries the information, not the number.
Flag calls where sentiment dropped in the second half and find out what was said at the turn.
Talk time by deal stage
How the rep’s talk share changes as a deal progresses. A healthy pattern has the rep listening most in discovery and speaking more in demo and proposal stages. A rep whose ratio never changes is running the same call every time regardless of where the buyer is.
Check that reps adapt their approach by stage rather than repeating one script.
Metrics that look useful but mislead
Every conversation intelligence dashboard reports these, mostly because they are easy to compute. Coaching against them wastes time at best and makes reps worse at worst.
×
Filler word count
Counting “um” and “like” is easy, which is why every tool reports it. There is little evidence that filler words affect close rates, and coaching them makes reps self-conscious in a way that usually damages the conversation more than the fillers did.
×
Average call duration
Longer is not better and shorter is not more efficient. A twelve-minute call that disqualifies a bad fit is a success; a fifty-minute call with no next step is not. Duration only means something alongside outcome.
×
Total calls recorded
An activity number masquerading as an insight costume. It tells you the system is on. It tells you nothing about whether anything in those calls is improving.
×
Speaking pace
Words per minute varies enormously by person, region and language, and there is no defensible universal target. Coaching a rep to slow down when their pace is simply how they speak tends to make them sound rehearsed.
×
Raw sentiment score per call
A single sentiment number reflects the customer’s situation as much as the rep’s handling. A rep working a queue of renewals will always score better than one handling churn risk. Use trajectory, not the average.
Benchmark table
Reference ranges for the metrics that have defensible ones. Use these as a starting point and replace them with your own numbers as soon as you have enough won and lost calls to compare — your market, deal size and call type all shift the targets.
Metric | Healthy range | Investigate if | What it usually means |
| Talk-to-listen ratio (discovery) | 40–45% rep | Above 65% rep | Presenting instead of diagnosing |
| Longest rep monologue | Under 2–3 min | Over 5 min | Call stopped being a conversation |
| Questions asked (discovery) | 11–14 | Under 5 | Qualification is not happening |
| Open question share | Majority open | Mostly closed | Checklist, not a conversation |
| Next-step commitment | Specific date agreed | “I’ll follow up” | Deal will stall |
| Pricing raised | After value is clear | First few minutes | Becomes a negotiation |
| Sentiment trajectory | Flat or rising | Falls after midpoint | Something was said |
These ranges reflect figures commonly cited in published conversation intelligence research. They vary by industry, deal size and call type, and none of them is a rule — your own won-versus-lost comparison is always the better benchmark.
How to start in one week
You do not need a platform, a data analyst or a project. You need twenty transcripts and a spreadsheet. Most teams that fail at this fail by trying to track everything at once.
You are on an active call
The call is connected on one device — a desk phone, a desktop app, or a browser tab.
Pick twenty calls with known outcomes
Ten that closed, ten that did not, from the same stage and roughly the same deal size. Known outcomes are what make the comparison meaningful.
Track three metrics in a spreadsheet
Talk-to-listen ratio, questions asked, and whether a specific next step was agreed. Three columns, twenty rows. Resist adding more.
Look for the gap, not the average
Compare won against lost. The interesting finding is almost never the team average — it is the one metric where the two groups diverge sharply.
Change one behaviour, then re-measure
Pick the single biggest gap and coach that one thing for a month. Measuring fourteen metrics and changing none of them is the most common failure here.
The bottom line
Transcript analysis fails when it becomes reporting. A dashboard showing fourteen metrics that nobody acts on is worse than no dashboard, because it creates the feeling of insight without the work of changing anything.
Pick two or three metrics a rep can change on their next call — talk-to-listen ratio, questions asked, next-step commitment is a reliable starting set — compare won deals against lost ones in your own data, and coach the single biggest gap for a month. Then add a metric. That is slower than switching on a platform and far more likely to move a number that matters.
Start with a Transcript for Every Call
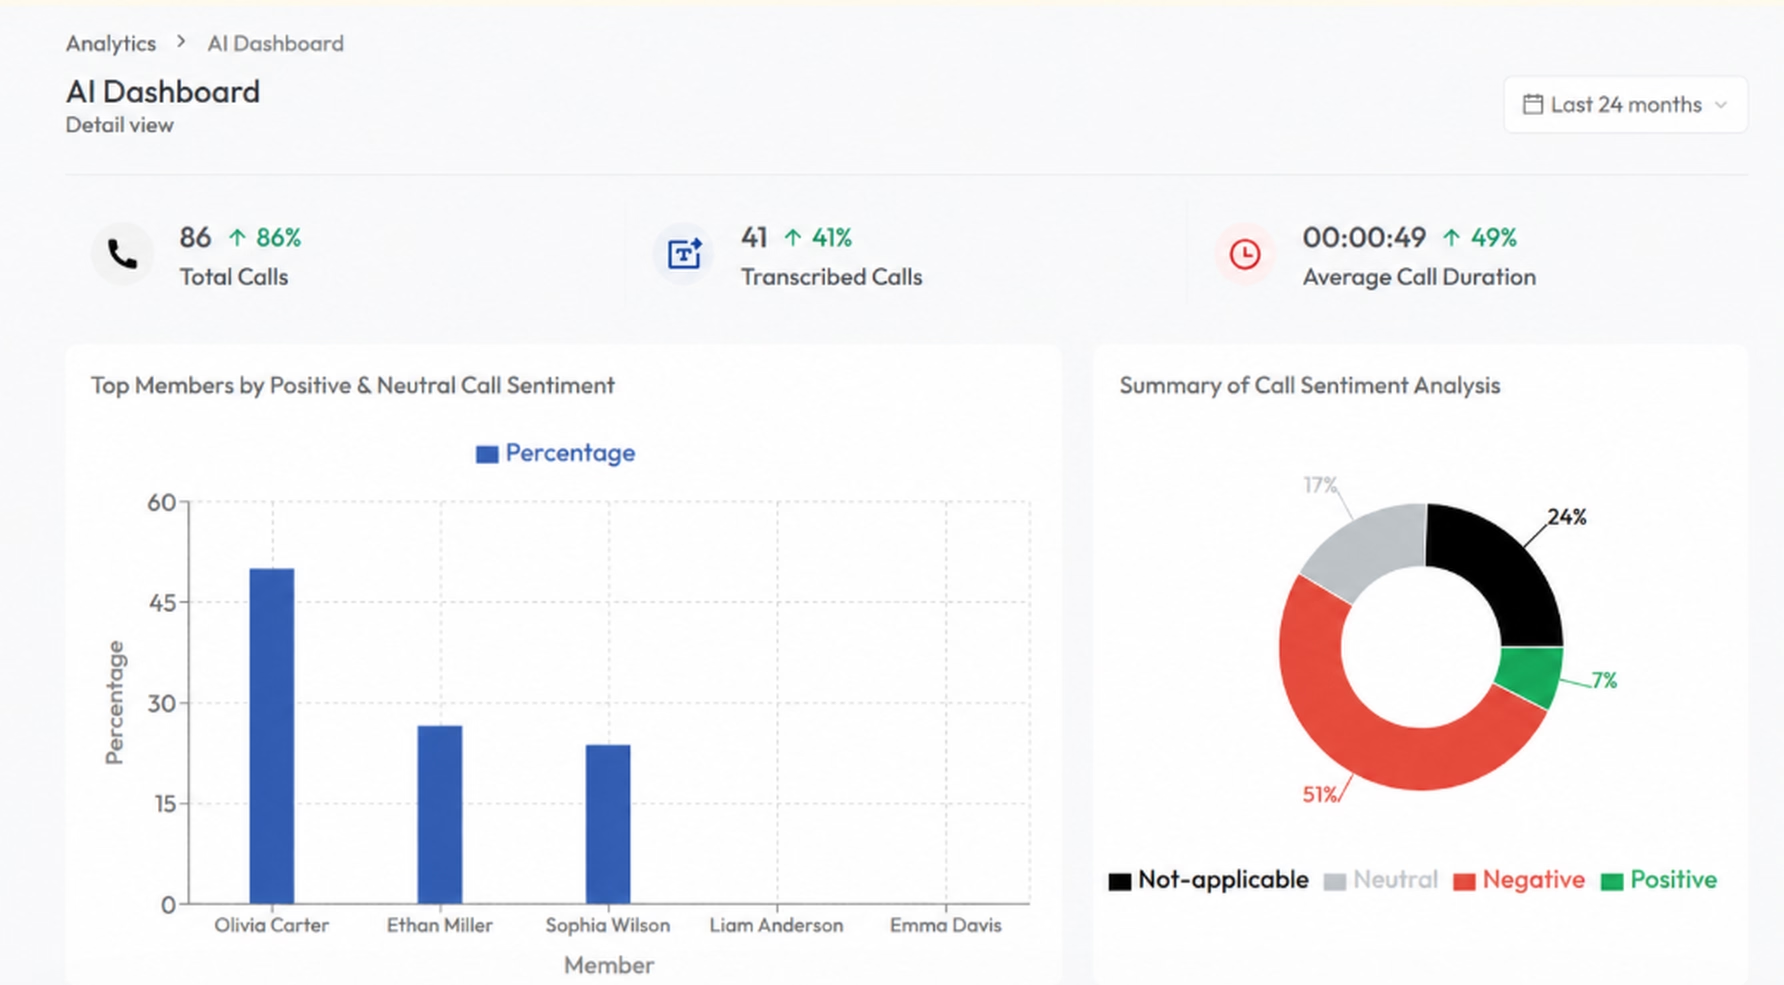
Calilio generates a transcript, summary, call reason and sentiment read on every recorded conversation, attached to the contact. Included at $28 per user per month with a 14-day money-back guarantee.
Summarize this blog with:
Frequently asked questions
What is sales call transcript analysis?
Sales call transcript analysis is the practice of turning recorded sales conversations into text and then measuring what happened in them. Instead of a manager listening to a handful of calls, software transcribes every call and extracts measurable signals — talk-to-listen ratio, questions asked, competitors mentioned, whether a next step was agreed. The value is moving from anecdote to pattern across hundreds of conversations.
What is a good talk-to-listen ratio on a sales call?
Which sales call metric predicts closed deals best?
How many questions should a rep ask on a discovery call?
How do I analyse sales call transcripts without buying expensive software?
Should I score reps on these metrics?
Do I need consent to record sales calls?
How accurate are call transcripts?

Still have questions?
Can’t find the answer you’re looking for? Please chat with our friendly team.
Stay in the loop
Get the latest call insights, trends, and updates delivered straight to your inbox.
By subscribing, you agree to receive updates from Calilio.
You can unsubscribe anytime.
Enter the World of AI Business Phone System with Calilio
Improve your business operation with Calilio's advanced virtual phone system. Join today for a better way to connect.